Company Profitability
Profitability Analysis and Optimization

Challenge
- For the Client:
- The company lacked a centralized view of profitability. Data on costs, benefits, and lead generation was fragmented, limiting visibility across periods and making it difficult to identify trends, optimize costs, or detect revenue opportunities on time.
- For Bit Solution Group:
- The challenge was to unify scattered data into a reliable, real-time ecosystem, designing profitability KPIs, dynamic filters, and advanced visualizations that could transform complex information into clear insights for faster and smarter decisions.
Our Solution
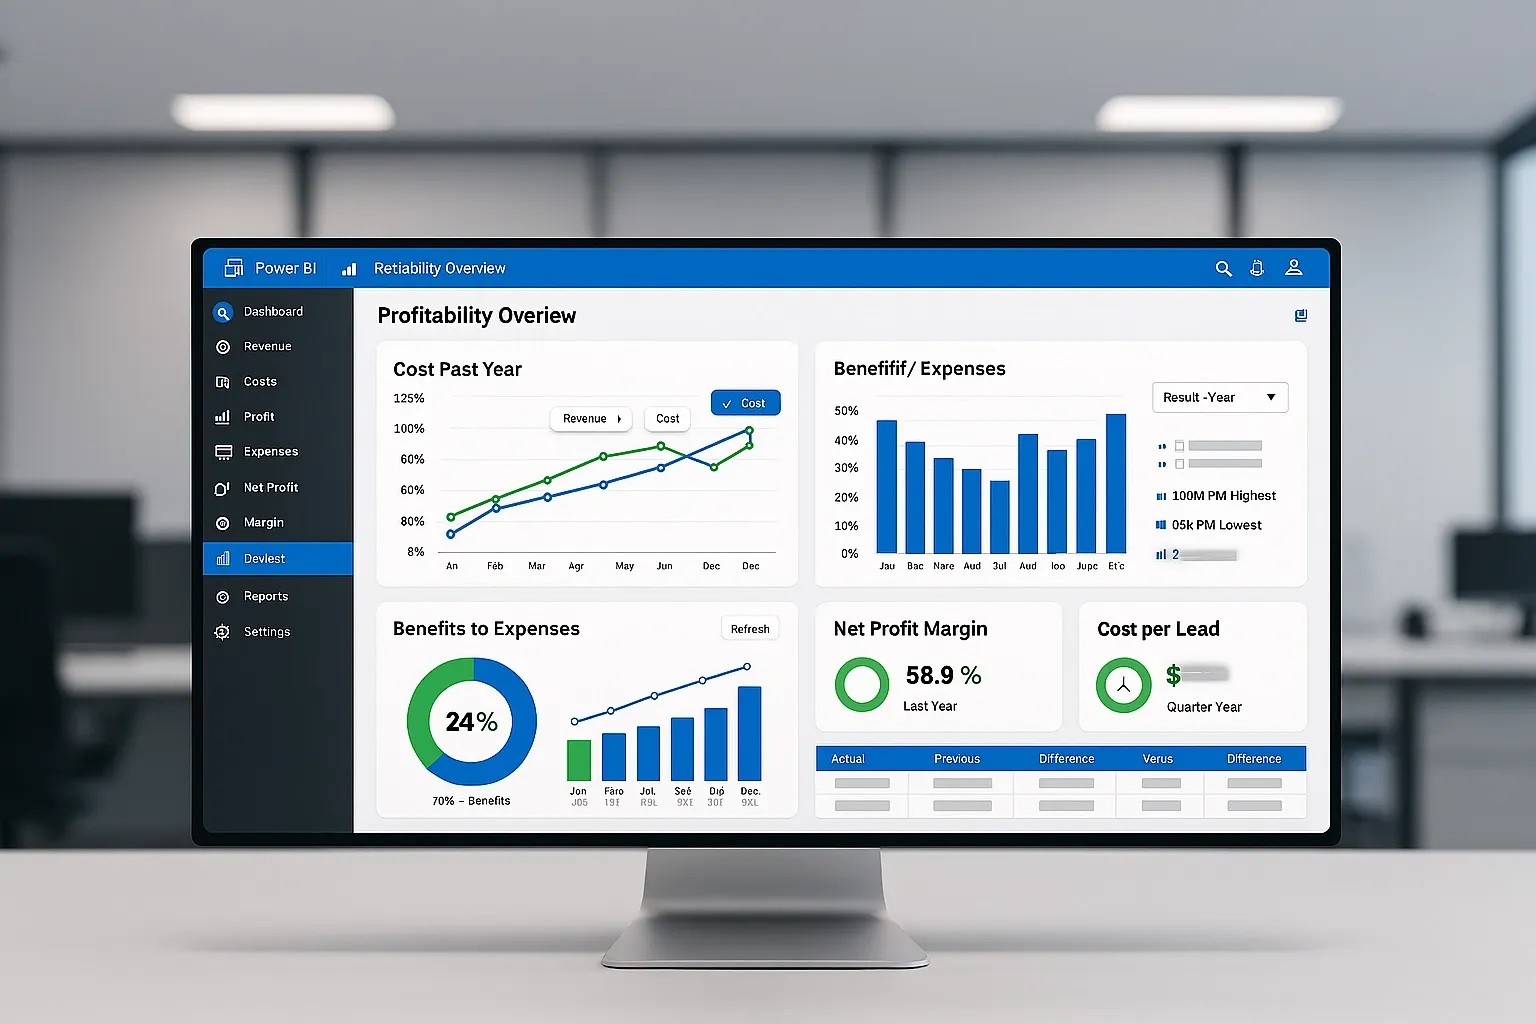
Create a report to provide a comprehensive view of the company’s profitability, centralizing data on costs, benefits, and lead generation. Designed to help users identify trends, analyze specific periods, and make strategic decisions based on reliable and up-to-date information. Additionally, it provides insights into how each business dimension contributes to overall profit and operational performance, while helping detect opportunities for cost optimization and revenue generation on time.
Key Features
- Profitability KPIs: include the main financial indicators and lead generation metrics. The KPIs show both aggregated values and internal breakdowns for more detailed analysis.
- Dynamic Filters: traffic source for general and specific analysis. Date filters (e.g., last day, this week), and custom range selection.
- Advanced Visualizations: Overview page with tables and bar charts highlighting the Top 10 and the Lowest 10.
- Maps with Dynamic Tooltips showing performance by state, with integrated tables for a more detailed view.
- Comparative Date Matrix using a structured Date Matrix with year and month, allowing comparison of metrics across different years, months, or periods within the same year.
Benefits
- Provides a comprehensive analysis of profitability at all levels of the company.
- Facilitates optimized decision-making by identifying the main sources of cost and benefit.
- Enhances user experience with an interactive and flexible interface, through to dynamic filters and enriched visualizations.
- Brings financial and operational transparency, allowing identification of opportunities for improvement in both costs and generation.
Techniques
- Advanced DAX for customized measures of profit and costs, including total company costs.
- Custom Tooltips integrating tables or charts within other visualizations for greater granularity.
- Nested Visualizations that allow detailed data exploration while maintaining an overall perspective.
- Date Matrix as a central technique to compare metrics across different periods and facilitate temporal analysis of business performance.